Throughout the MK.8 design cycle, my role as Drivetrain Lead primarily involved mentoring junior engineers on their projects, ensuring that each calculation and design decision was well thought out.
In addition, I took on a huge project myself: validating the cooling system we had been running on previous cars and speccing out our next-generation system.
This page is just a synopsis! See all my work here (calcs) and here (report)
I started by reverse engineering the MK.7 cooling loop in SolidWorks to work with the system in CAD.
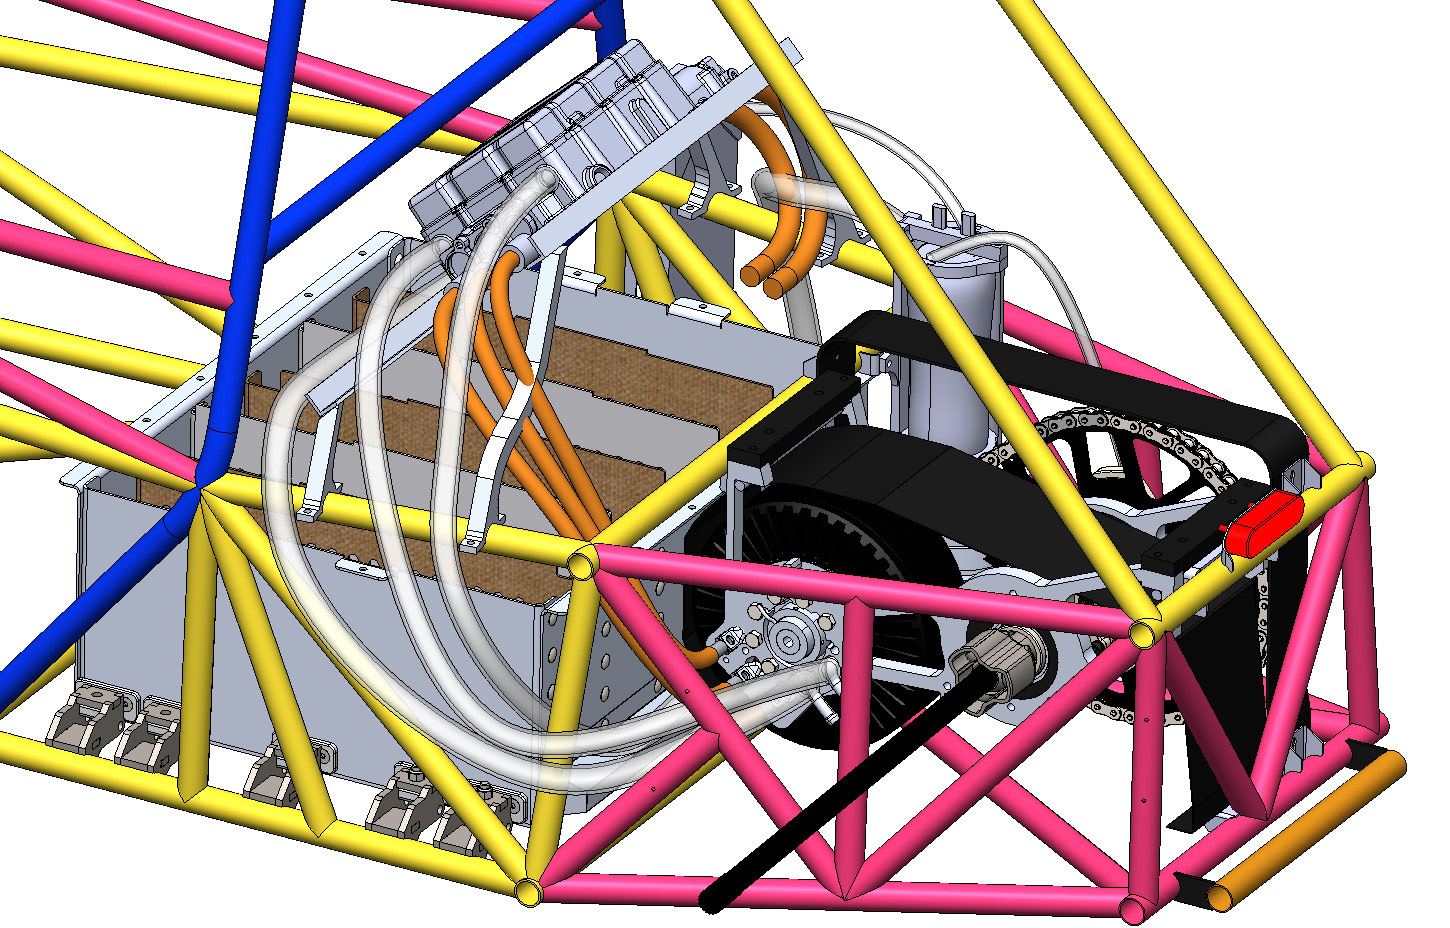
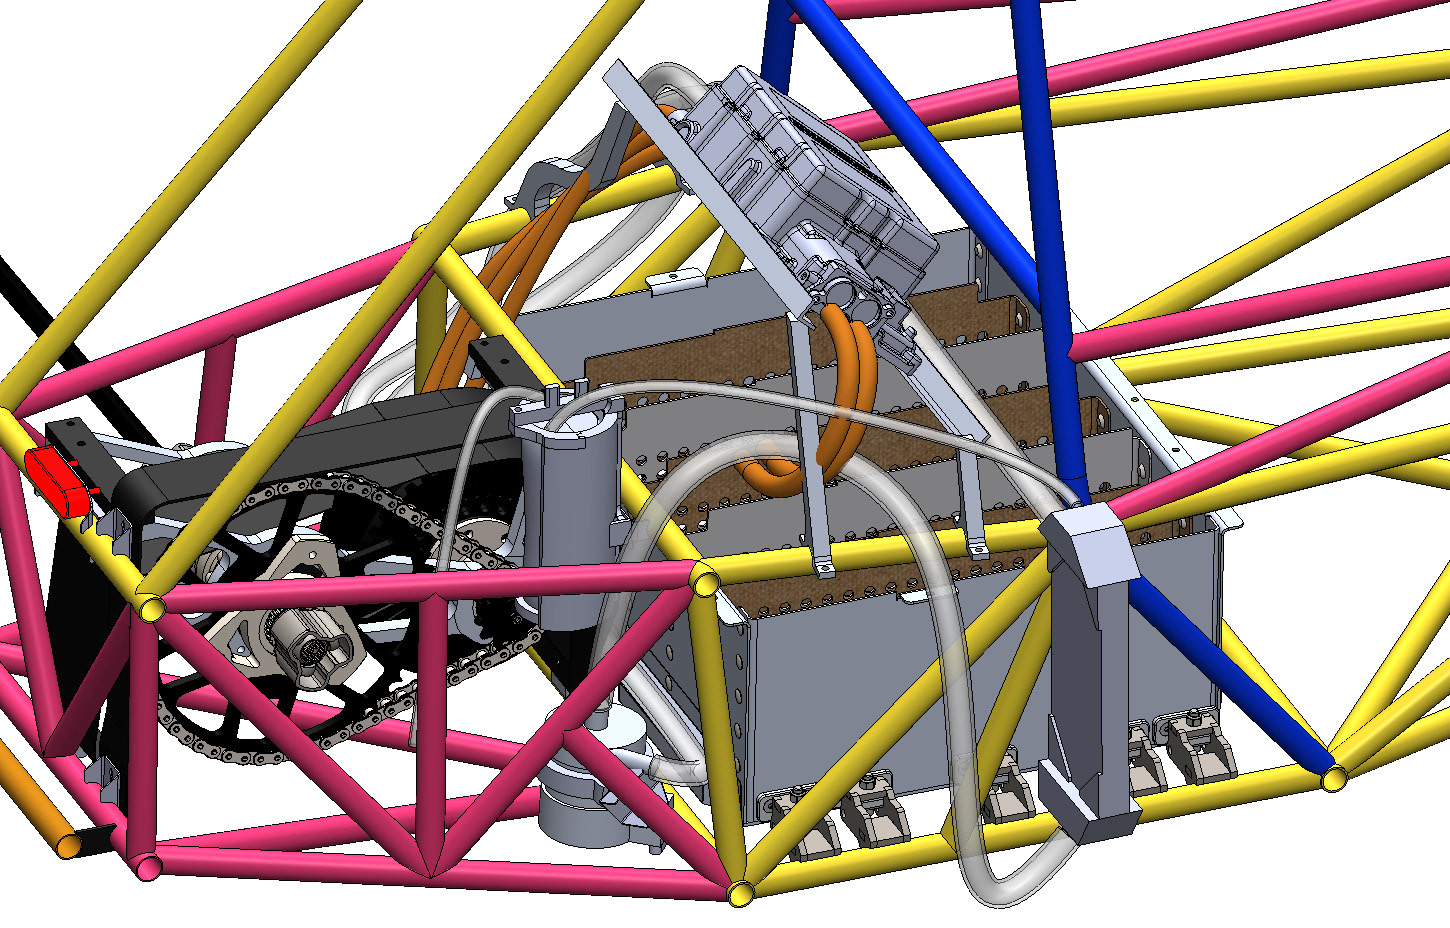
This was a tedious task that involved a ton of 3D splines to match the tubing from reference images to the model.
As you can see from the sharp bends and awkward routing, this cooling loop was very difficult to fill, drain, and bleed air out of.
After seeing this rat's nest, I made hose routing and usability my utmost priority for MK.8 (second to cooling performance).
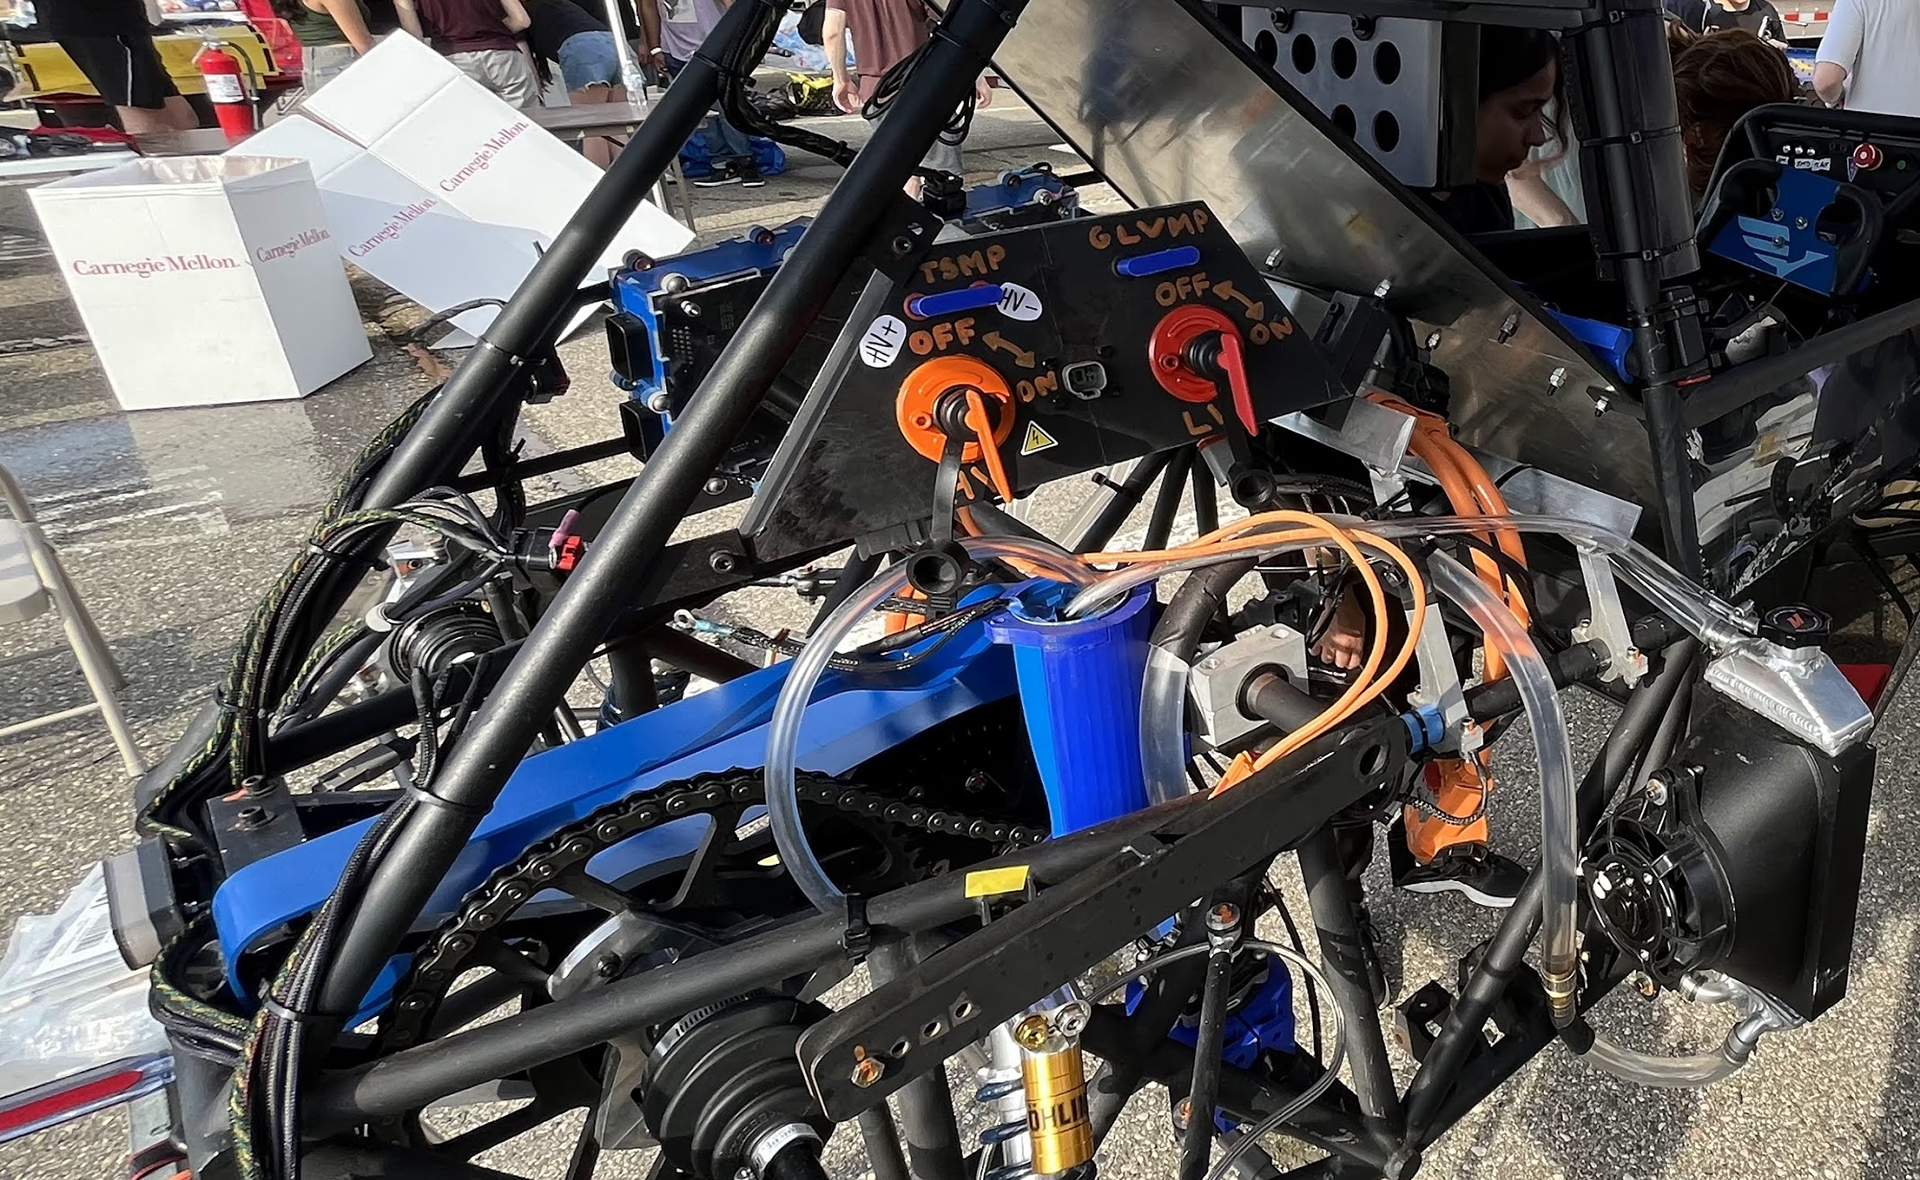
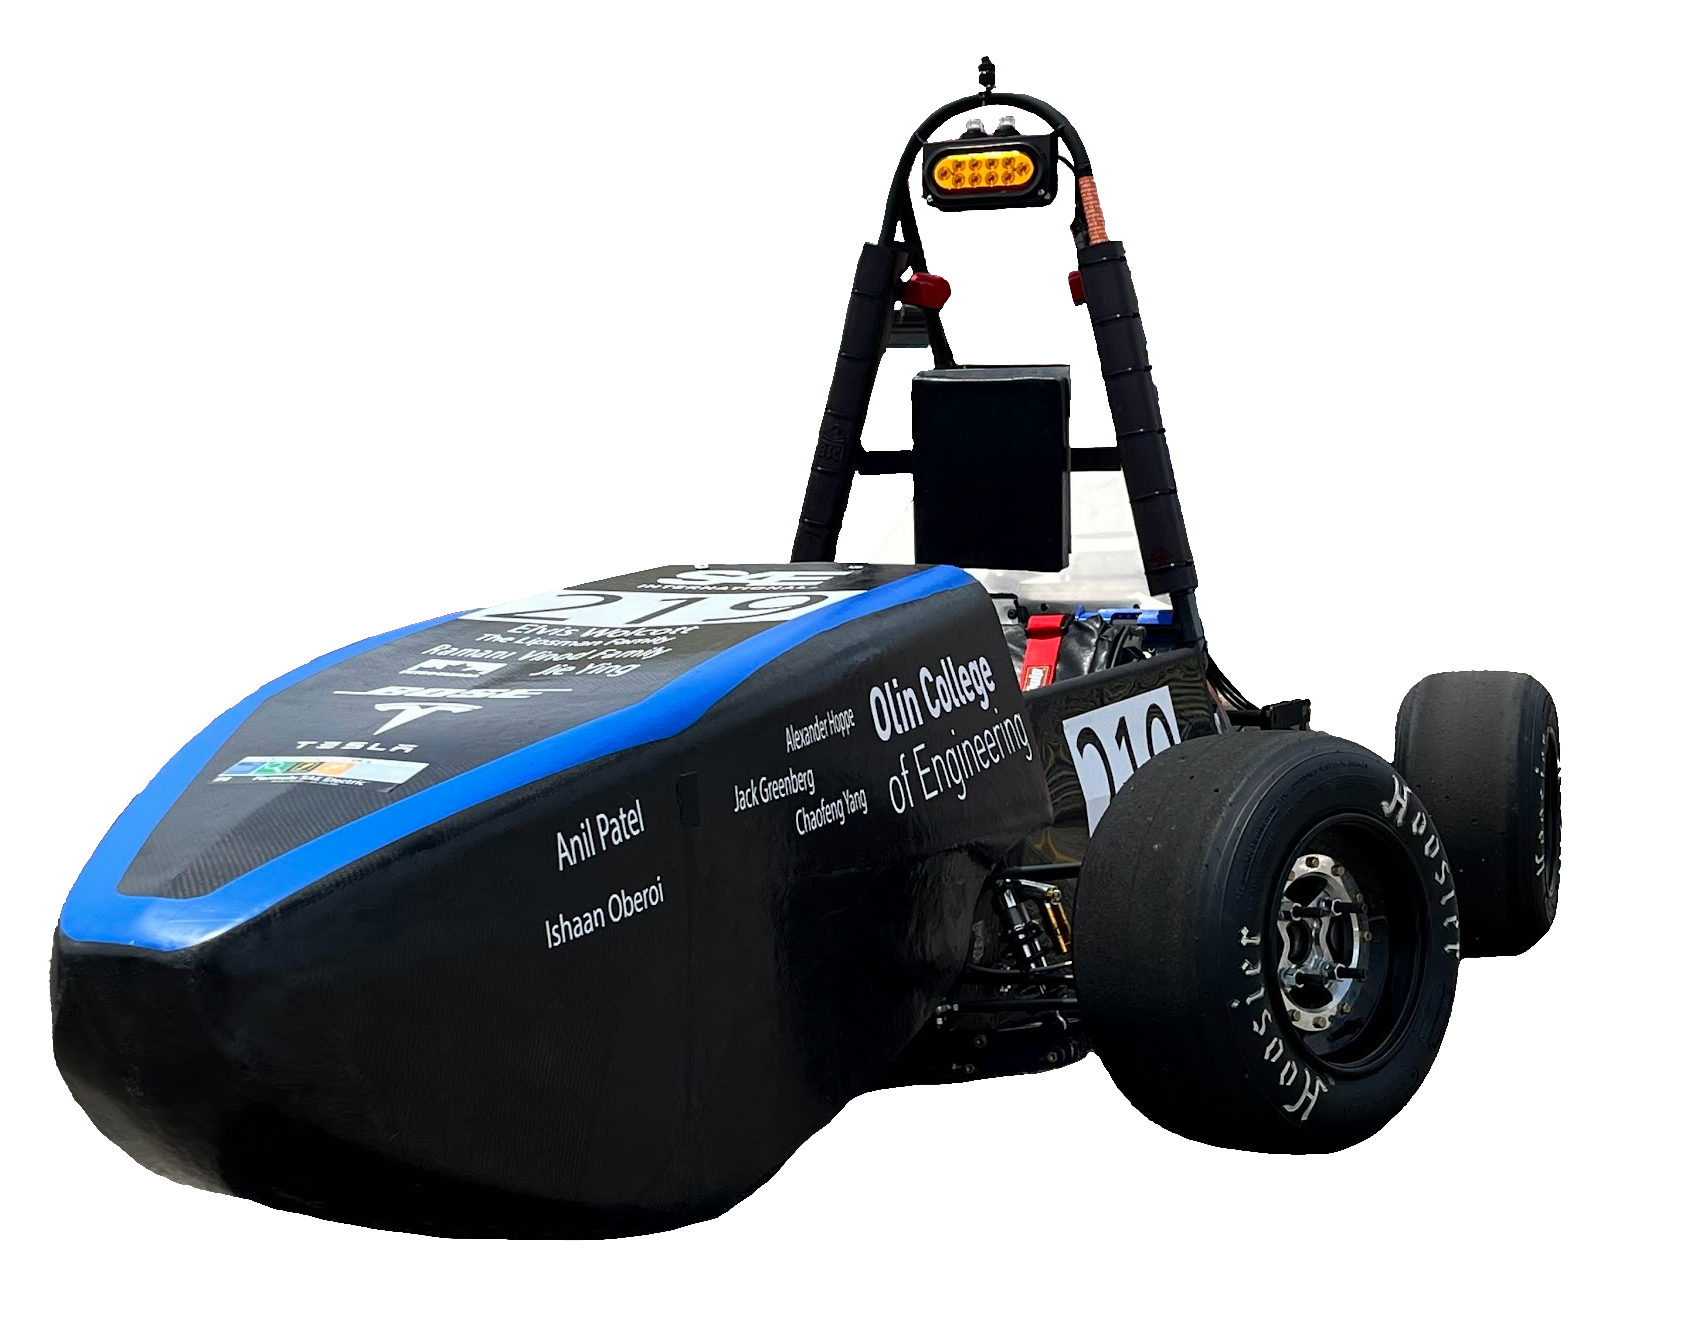
How the car stood at Michigan Comp 2025
As I hadn't taken Thermal-Fluids Analysis at the time, many of the initial calculations were performed by following the work of Filip Jander, leading me through three main calculations: Pressure Drop, Heat Rejection, and the ε-NTU Method.
Starting with the pressure drop calculations, this allowed me to validate whether our pump was able to provide enough flow rate without being choked out by the tubing or components.
This calculation mainly involved using the Darcy-Weisbach Equation for the major losses due to the long tubing runs, and using area ratio and compression/expansion equations for each of the fittings.
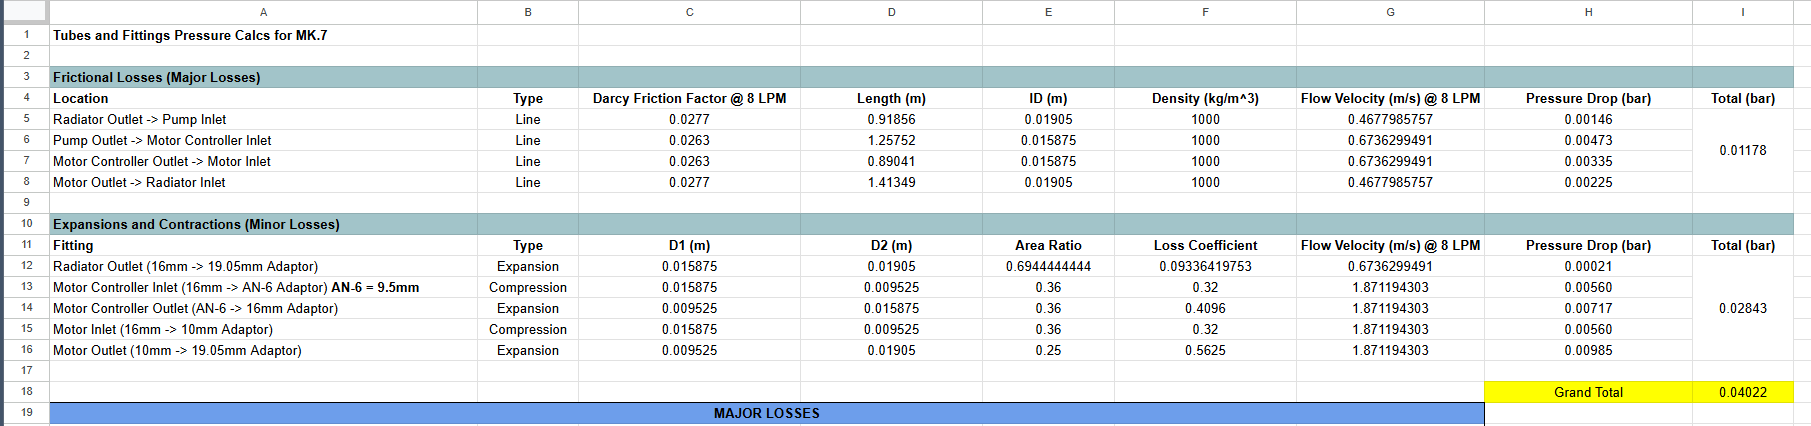
The tubing and fittings added up to 0.04 bar while the motor and motor controller added up to 0.9 bar.
As a result of this calc, I was able to validate the MK.7 pump, noting that most of the pressure drop in the system came from the motor and motor controller, rather than the tubing and fittings!
As can be seen below, our specced CWA150 was right within our specifications of 8-12 LPM at a delivery pressure of ~1.7 bar.
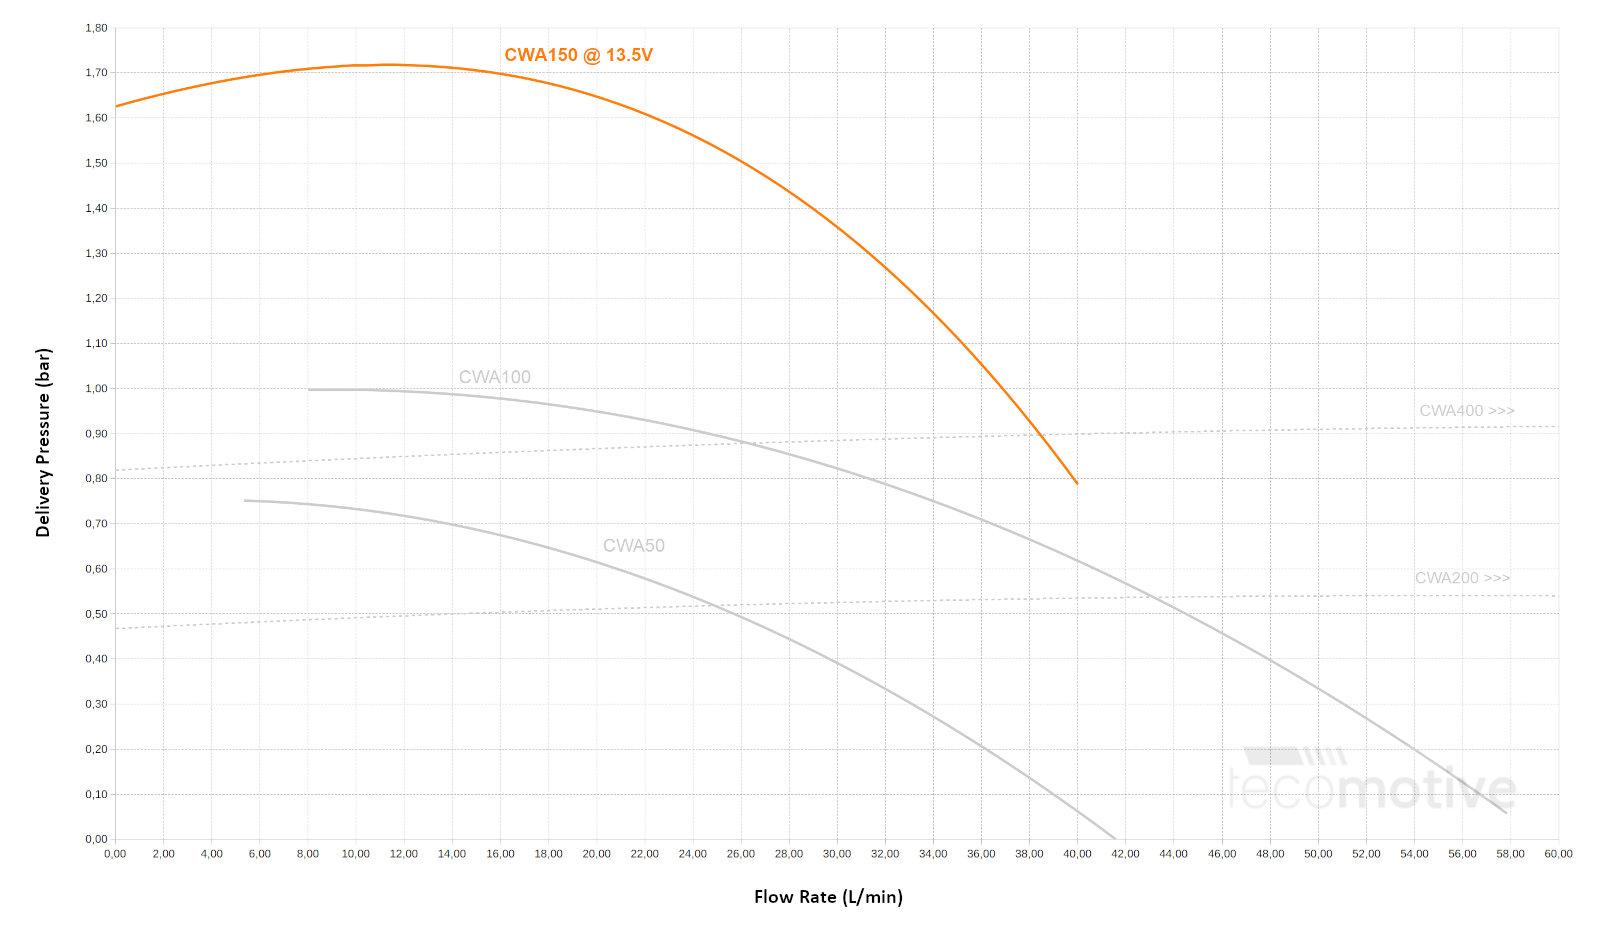
Pierburg CWA150 Water Pump Curve
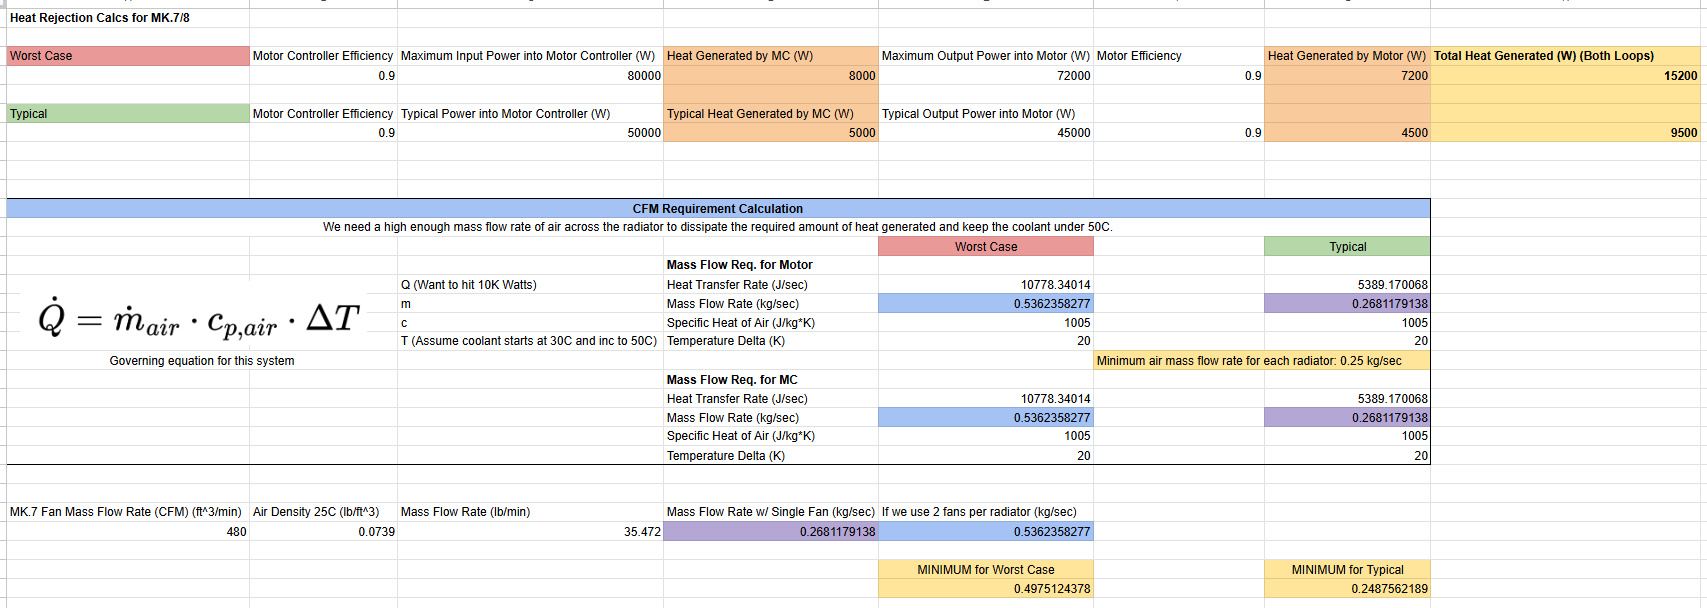
Moving on to Heat Rejection and ε-NTU, these calculations were intertwined with each other. I modeled the system with control volumes and examined all its sources and sinks of heat to validate whether our fans and radiator were up to spec (shown below).
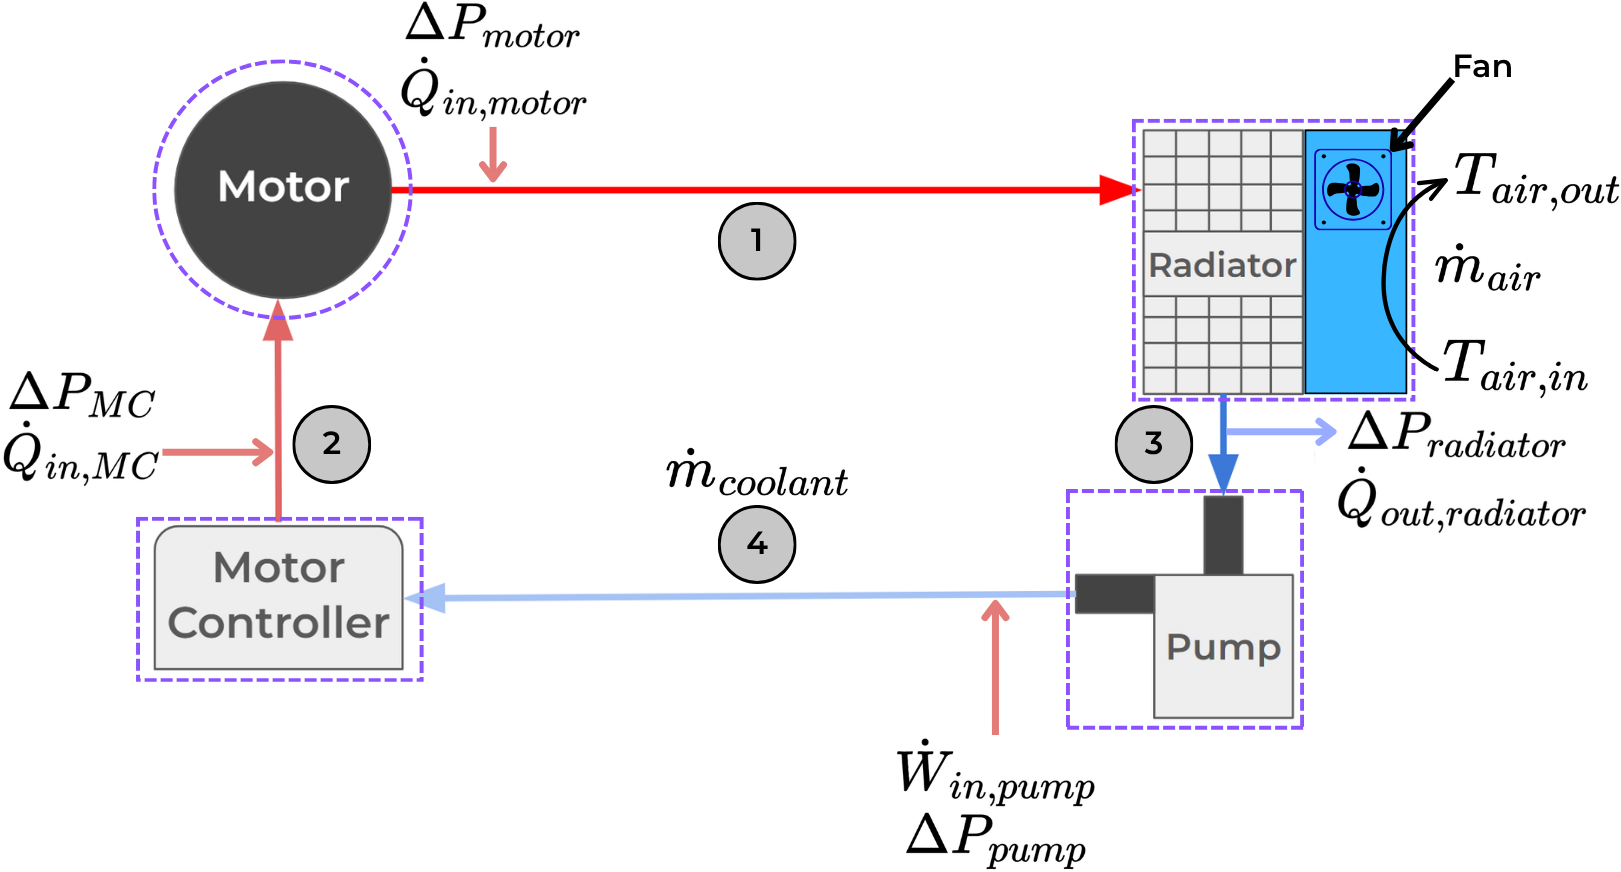
As can be seen, the motor and motor controller are the largest contributors to heating the coolant, with the flow rate of air across the radiator rejecting this heat.
By referencing the efficiency map of our motor (EMRAX 228) and the typical efficiency of our motor controller (Cascadia CM200), along with the energy output of our accumulator, I calculated a typical and worst-case heat generation of the system during an endurance race.
I found that the system generated around 10,000W under typical driving conditions. Equating this number against the heat transfer equation (Q̇ = ṁcΔT), I was able to approximate the mass flow rate of air across the radiator to reject this heat.
Given this mass flow rate of ~0.25 kg/s, I was able to validate the fans we had specced on MK.7, showing that we would need two per radiator in the worst case.
Validating the radiators is where I started running into a lack of testing.
My Thermal-Fluids Analysis Final involved using the effective NTU method to validate our radiator, and the analysis output a required UA value that was much higher than our radiator could provide.
To give you context, the ε-NTU method determines heat exchanger performance. It validates a radiator by comparing its actual heat transfer to the maximum theoretically possible.
It involved a few dimensionless parameters:
1. Effectiveness (ε): The ratio of actual heat transferred to the maximum possible heat transfer.
2. Number of Transfer Units (NTU): A measure of the radiator's total heat transfer size and capacity. It is calculated using the overall heat transfer coefficient (U), the heat transfer area (A), and the minimum heat capacity rate.
3. Capacity Ratio: The ratio of the minimum to the maximum fluid capacity rates.
From my initial analysis, our system would require a radiator with a UA value of 1292, which is extremely high, with typical motorcycle radiators only reaching around 250.
My conservative estimate of air mass flow rate across the radiator (only considering the fan) is definitely the cause of this, and real-world testing is needed to calculate this value.
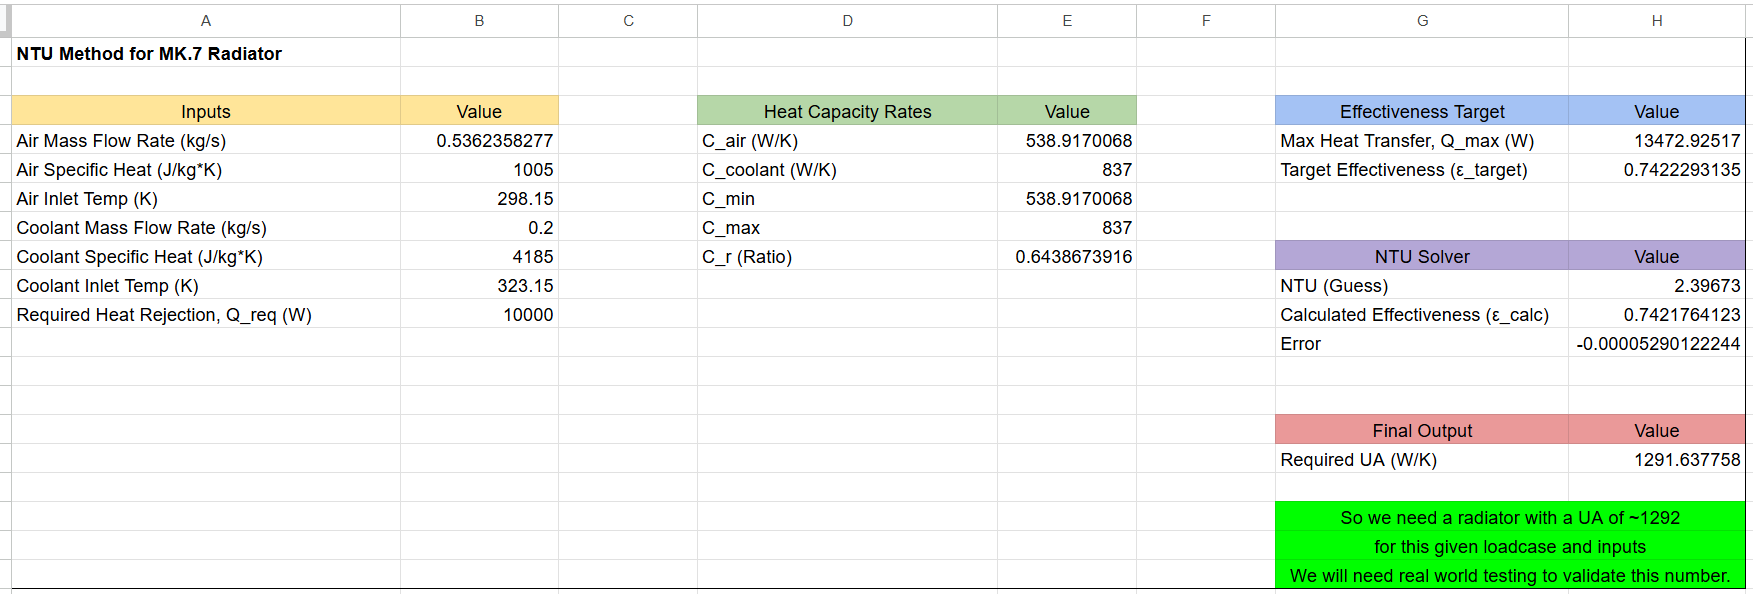
This analysis uses a Goal Seek add-on for Sheets that iteratively solves for the Required UA value by guessing different NTU values until the Calculated Effectiveness is close enough to the Target Effectiveness
Although I was able to build a model for analyzing radiator selection, there definitely needs to be real-world testing to understand the actual mass flow rate of air across the radiator to calculate a proper UA value for our MK.7 radiator.
This project is still a work in progress, going into our second year for MK.8. Check back in for updates!